On 11 May, I presented a paper at the Popular Culture Association of Canada’s second annual conference in Niagara Falls, Ontario. I thought rather than just limiting the presentation to the physical audience, I would make it available here as well.
I am always looking for collaborators, people to bounce ideas around with, etc. This was my “training exercise” to learn how to program in Mathematica and some of the basics of visualization, web scraping, etc. So if any of this might be useful to your own research, please let me know via e-mail.
The actual talk itself was dynamic. Unfortunately, because the dataset isn’t online yet, we’re in a weird situation of having a digital talk being less interactive online than it was in person.
Thanks are especially due to William J. Turkel, who got me started on this project, helped scrape the lyrics, and provided feedback throughout as I learned how to do much of this.
What follows is the rough text of my talk, coupled with the slides. Please click through to see it all.
Hi everybody. In this slightly unorthodox paper I want to take a few minutes to introduce you all to a project that I have been working on, the Billboard Top 40 Lyrics Database, give you a sense of how it was created, how it works, and to hopefully get thoughts and input from you before we begin moving forward to a version that looks nice and can work online. Right now, I need to emphasize that it is a rough version: it is working, the code is still being refined, etc., and once I have a good sense of what I should be doing, I’ll start investing time in a nice, easy to use user experience.
So let me begin.
The impetus for this project came from two sources.
Firstly, my current project at Western University is looking at postwar youth cultures, using digital methodologies. At this stage, this means accumulating massive amounts of information: downloading federal government documents, trying to get into newspaper databases, interacting with Google databases, basically filling up my hard drive with GB after GB of information from web scrapers.
So, initially, lyrics came to mind in the context of that project. Could we use lyrics, on a massive scale, to glean some sort of insight into postwar cultural history? Moving beyond the close reading inherent in each individual song to the mass reading of many. In this, I was inspired by a work of English lit.
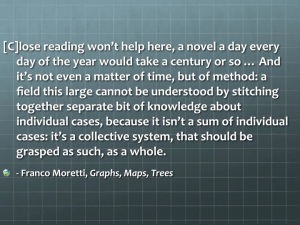
Franco Moretti, in his 2005 groundbreaking work of literary criticism Graphs, Maps, Trees, called on his colleagues to rethink their disciplinary approach. With the advent of mass produced novels in 19th-century Britain, Moretti argued that scholars must rethink their disciplinary approach. Traditionally, literary scholars worked with a corpus of around two hundred novels; though an impressive number for the average person, it represents only around one percent of the total output. To work with all of this material in an effort to understand these novels as a genre, literary critics required a disciplinary rethink:
[C]lose reading won’t help here, a novel a day every day of the year would take a century or so … And it’s not even a matter of time, but of method: a field this large cannot be understood by stitching together separate bit of knowledge about individual cases, because it isn’t a sum of individual cases: it’s a collective system, that should be grasped as such, as a whole.
Instead of close reading, Moretti called for literary theorists to practice “distant reading.” Could this apply to lyrics?
Secondly, to be honest, I was learning how to program. And I needed a practice dataset. So, why not this. It also seemed fun to me, could help make some points about how pop culture in aggregate in the 1960s doesn’t necessarily reflect what we think it does (i.e. the most popular songs were about love, sappy, etc., whereas we often remember – at least at a popular level – as peace, politics, folk music, etc.). So, I thought we could maybe make a tool that could make a real intervention into public history.
It’s my firm belief that history is only so good as the way we disseminate them. So part of my dream idea here is to make a game that people might want to play with.
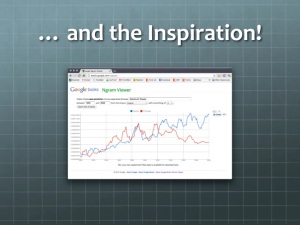
The inspiration for this project was the Google n-gram viewer. Launched by the Culturomics Institute at Harvard University, and making a splash with a great article in Science Magazine, this is probably the most visible and high-profile digital humanities project. For this project, the team of authors processed five million books within the Google Books corpus, some 5% of all books ever published in human history. The end project was put online, first by Google Labs and now by Google Books, and lets you play around with trends and seeing the rise and fall of cultural ideas.
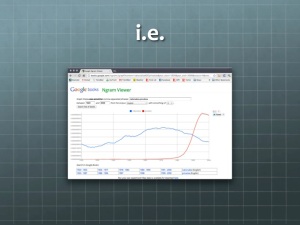
See, for example, ‘nationalize’ and ‘privatize.’
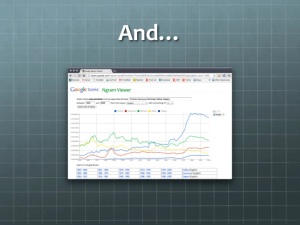
Or, the relative appearance of Canadian cities…
So this looked like fun, a neat way to cut my chops on some code. A practice dataset is hard to find, not to mention a large one, textually based, and learning the basics of Natural Language Processing.
With blocks of text, you have to find some way to make it into something you can actually work with.
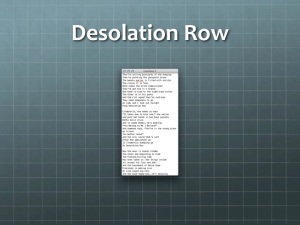
So this is a neat project. Now, the building block of all this is the n-gram. How can you arrange text into this sort of processing? First of all, take a chunk of text. Here, let’s take “Desolation Row” because it’s such a long, epic Bob Dylan song.
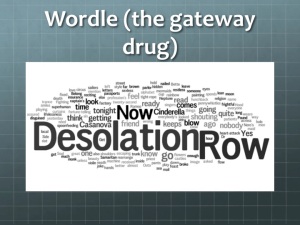
Now, the ‘gateway drug’ into visualization is a Wordle. They suck for a number of reasons: you can’t get into context, they can obscure at times more than they can illuminate, etc. But still, they work to show how often a word appears. So if we take Desolation Row, split it into words, and count them and tally them up, we get this – in text at left, visualized using our gateway drug at right.
So, the best way to understand Wordle is that it is taking unigrams – single words that appear throughout – plotting their frequency, and arranging them in an aesthetically pleasing way.
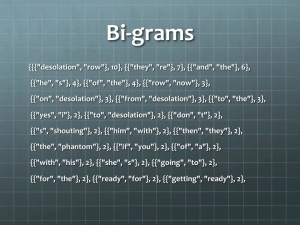
So if we instead of taking individual words, we take phrases. So here are the bi-grams for Desolation Row.
Trigrams…
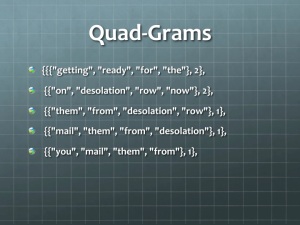
Quadgrams… and so on, until we can just call them n-grams.
So, now that you’ve had your introduction to some of the very basics of Natural Language Processing, where do lyrics come in?
What, I ask, if we could get 10,000 lyrics and do to each what we did to Desolation Row – breaking up into patterns of phrases, words, calculating frequency, etc. Turning each into a set of a dataset.
Would we see patterns emerge? Trends?
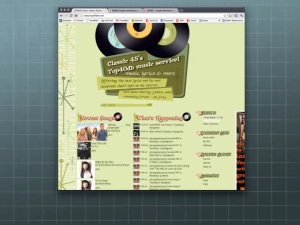
The first step was to get lyrics. These are problematic because they are heavily copyrighted, often inaccurate, and so forth. The place I went was the Top40DB.net: Classic 45’s Top40dbMusic Service! Music Lyrics and More! Arguably, the best repository of crowd-corrected music is here. Even more importantly, this database can be interacted with a machine.
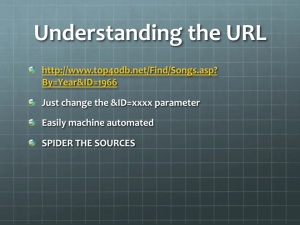
So we go to a page like this: http://www.top40db.net/Find/Songs.asp?By=Year&ID=1966, begin to change the year variable, scrape out the lists, and then begin harvesting all the lyrics in easy to read text form.
Just for your information, I’ve put up how easy this is: there’s the URL for the year 1966, for example. If you chane that last section to 1967 for example, it pops up. So basically, if you think back to algebra, you could just set ID=x, change that variable between the years you want – in my case 1964 and 1989 – and get a list of all the pages.
We then go into each of those pages, write a quick spider to get all the LINKS to the text files. Then there are a number of quick ways you can take a list of links and download them onto your system. If you wanted to go through, right clicking and downloading on each, you’d not only develop carpel tunnel syndrome, but you’d be deathly bored. This is a far more effective use of your time. Of course, a proviso: lyrics are copyrighted material. So we will need to figure out a way to turn them into something non-copyrighted shortly.
Incidentally, this sort of URL trick scales: Library and Archives Canada can generally be navigated in a similar way, and you can pretty quickly figure out how their databases work. For example, I downloaded the entire chart section of RPM magazine from Library and Archives Canada as a training exercise, something that took me about an afternoon when learning, and with the basic skills that I now have I could do it all quickly.
The next step is to actually make it so that we don’t work with lyrics, but instead just frequency data. So, imagine we take the bigrams of each song instead of the lyrics, like so.
Now, if you did this to 10,000 lyrics and started to aggregate by year, you’re getting very far away from the original material. So we do the conversion and only work with unigrams, bigrams, trigrams, quadgrams, etc. N-grams.
Now that we have all this material, how can we interact with it?
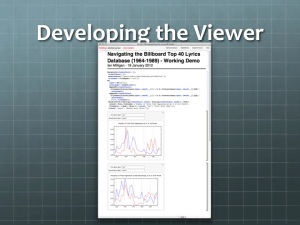
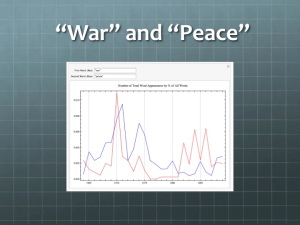
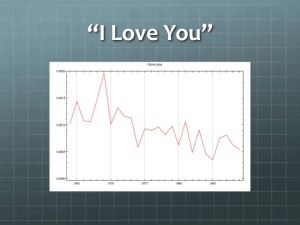
So the idea comes to begin counting these things, whether it be the one word frequency or unigrams, or the three-word frequency, or trigrams, and so forth. Go through, count how often they appear, and then plot them onto a graph.
i.e. “War” and “Peace.”
Or “I Love You.”
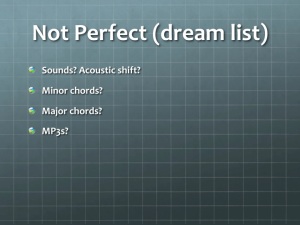
It isn’t perfect, by any means. Ideally, I would do something with sounds. The initial plan was to grab small samples of MP3s, but even that is turning out to be nearly impossible with copyright and other technical problems. Would we detect an acoustic shift, with chords, minor, major, as time goes on? What if we began to compare that to the economy, or something like that?
A new idea was proposed recently by Devon Elliott however, which would be to do this to chords. Looking for minor chords, major chords, that sort of thing. What would we find?
At this point we switch into a dynamic demonstration of the program, taking attendee suggestions.
Ok, so why don’t we in the few minutes we have.. any searches that you want to run? I’ve enabled the tri-gram and the unigram databases on this laptop right here, but need to apologize if it isn’t fully user friendly yet.
What else would you want to see?
Would you use this?
Would you have fun using this?
The end-goal, then, is to put this online using a WebMathematica server. Western has expressed interest in getting me the server space, we put it online, and it can become an adjunct to studies. But a tool is only so good as its users, and what they want, so honestly, please let me know if there’s anything I should add here.
My thanks for your time.

